Visual Learning And Your Visual Content Strategy
For quite a while now, McKnight Kurland has been developing significantly more infographics, videos, icons, brand imaging strategies and visual navigation websites for our clients. I’ve discussed this not-so-new trend before as an outgrowth of new technologies and smaller screens where, for instance, complex apps and tasks on your phone are symbolized by simple yet meaningful icons; where navigation through your choices on Xfinity becomes a visual ‘bookshelf’ instead of a type listing.
You’ve probably seen the statistic that 65% of the population are visual learners. But do you truly understand what that means in terms of comprehension and retention?
Comprehension and Retention
Not only are those terms used for learning (in the education realm), they are key objectives in effective marketing strategies—every brand, campaign and value proposition begs to be fully comprehended and retained by its target audience. A bit of Google searching brought up this article from SHIFT about visual learning. Here are a few highlights to help drive home the importance of visualization to learning which, again, is what we strive to do in marketing communications—have the viewer LEARN about the brand, the product or the service, COMPREHEND the message and RETAIN knowledge of it:
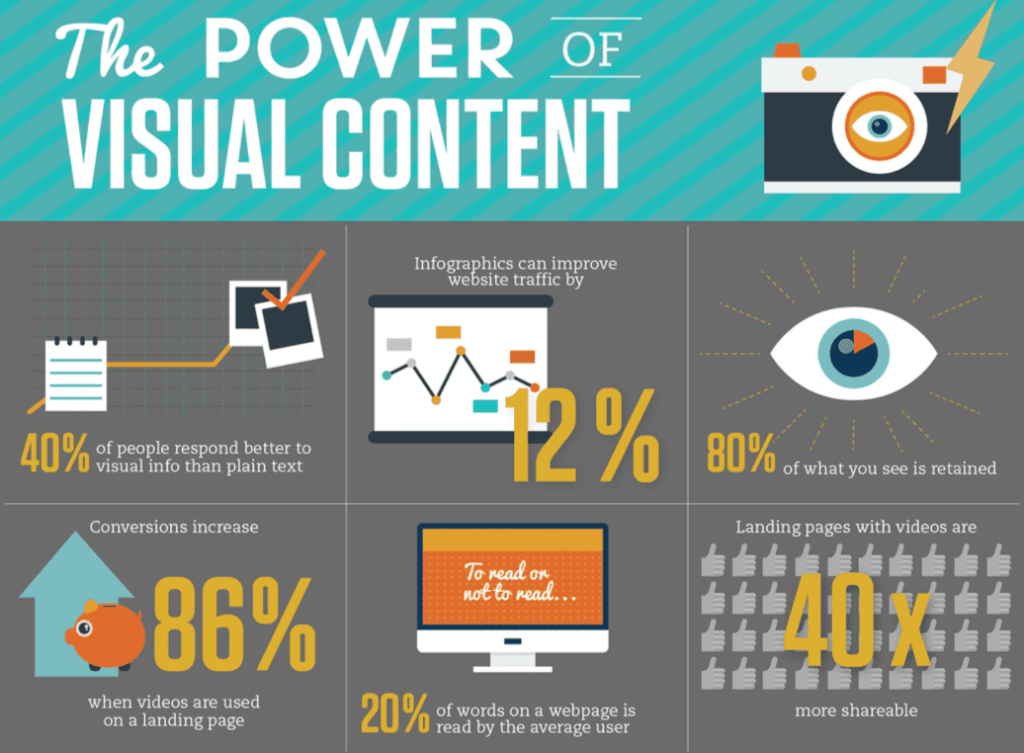
We are now in the age of visual information where visual content plays a role in every part of life.
Visuals Stick in Long-Term Memory
Both the short-term and long-term memory store information in chunks, but the former is limited. One of the easiest ways to ensure that learners store information in their long-term memory is to pair concepts with meaningful images. Research has found that this tactic increases recall better than when courses deliver information through aural or textual form. Visuals help people make sense out of the content and direct attention, increasing the possibilities that the learners will remember.
Furthermore, this effect increases over time. One study found that after three days, a user retained only 10-20 percent of written or spoken information but almost 65 percent of visual information. Another study showed that an illustrated text was 9 percent more effective than text alone when testing immediate comprehension and 83 percent more effective when the test was delayed.
Visuals Transmit Messages Faster
According to the Visual Teaching Alliance:
- The brain can see images that last for just 13 milliseconds.
- Our eyes can register 36,000 visual messages per hour.
- We can get the sense of a visual scene in less than 1/10 of a second.
- 90% of information transmitted to the brain is visual.
- Visuals are processed 60,000X faster in the brain than text.
- 40 percent of nerve fibers are linked to the retina.
All this indicates human beings process visual information more efficiently than text.
Visuals Improve Comprehension
Visuals have been found to improve learning by up to 400 percent. Also, they affect learners on a cognitive level and stimulate imagination, therefore enabling users to process the information faster. Stanford University’s Robert E. Horn, explained this relationship clearly “When words and visual elements are closely entwined, we create something new and we augment our communal intelligence … visual language has the potential for increasing ‘human bandwidth’—the capacity to take in, comprehend, and more efficiently synthesize large amounts of new information.”
Visual Cues Trigger Emotions
Visuals cause a faster and stronger reaction than words. They help users engage with the content, and such emotional reactions influence information retention. This is because the visual memory is encoded in the medial temporal lobe of the brain, the same place where emotions are processed. The brain is set up in a way that visual stimuli and emotional response is easily linked, and together the two form memories. Negative visual depictions are particularly useful for leaving a strong emotional impression.
Visuals Motivate Learners
Around 40 percent of learners respond better to visual information than text alone. Simply seeing a picture allows users to recreate the experience in their mind.
Creating A Visual Content Strategy
So now you understand why you should capitalize on visual learning by creating a visual content strategy. There are numerous forms of visual assets and content to incorporate but there is one golden rule:
Focus on content that reflects your brand and brand personality.
People—especially in the business world—are tired of boring, static, same-old-same-old images. Stock visuals that look like they could be used for any other brand, or worse, are used enough that individuals recall seeing them before, are simply wrong. Determine a strategic visual content style and create a document that covers the recommended subject matter, the aesthetic and emotional aspects, the preferred mediums and any customized technique(s) that makes the image reflective of your brand.
Infographics Explosion
With the onset of big data came the influx of infographics—just one of the tools in your visual content strategy toolbox—and with it, innumerable attempts to make reams of information meaningful and palatable. It hasn’t always worked. Many infographics are great at communicating statistics, trends and hard facts in a more appealing way than bullet points, but often times they don’t really serve to make a point or make information more digestible. And to use one in marketing, those criteria are crucial. One website curates what they deem as the ‘best’ infographics, and is fun to look through for ideas and reference. There are also a virtually unlimited number of images, galleries and sites on-line.
The trend we are experiencing at McKnight Kurland is to develop much clearer and simpler visual representations of a brand or brand promise. One recent project was for AMT (American Medical Technologists). AMT is a nationally and internationally recognized certification agency and membership society for allied health professionals. You can learn about the challenge and our solutions in our case study.
The take-away? Regardless of the form of visual representation—infographic, video, iconography, etc. —be sure the imagery reflects your brand and brand personality, aligns with your documented visual content strategy and clearly and simply visualizes a key communications concept.